
Editor’s Note: No one understands the complex, unhealthy relationship between the Federal Reserve and the economy like Lee Adler at Wall Street Examiner. Today he’s calling out the Fed’s zero-interest-rate policy for what it’s done to our housing “recovery.” Here’s Lee with five charts that detail how damaged our housing market really is…
Don’t believe any headlines that claim there’s a housing “recovery” in the United States. The truth is, there is no single family housing industry to speak of today.
What for generations was a main driver of U.S. economic growth has been brought down by the past seven years of the U.S. Federal Reserve’s zero-interest-rate policy (ZIRP). ZIRP has been a disaster for the U.S. economy, the middle class – just about every facet of American economic life has suffered from this fiscal disaster masquerading as coherent monetary policy.
Today I’m going to show you five charts that tell the story of exactly how much damage the Fed has done to U.S. housing. Most are derived from this week’s release of new home sales data from the U.S. Census Bureau.
You’ll see how the rise in home sales since 2011 has really been a four-year dead cat bounce that hasn’t helped most Americans, hasn’t meaningfully contributed to U.S. economic recovery – and now appears to be stalling.
New Home Sales at Recession Levels
To get a clear picture of where the housing market is now, let’s get out of the media echo chamber that housing data is typically reported in and put things in perspective.
According to Census Bureau data, home sales fell in September to 36,000 units. Looking at every September’s monthly sales since 1972, that data tracks like this:

While some analysts point to the growth since 2012, in reality new home sales are barely above housing depression lows, a mere fraction of 2005 bubble levels.
This “recovery” has not even reached the levels the home sales hit at the bottom of the 1992 or 1974 recessions. It has gotten back to the 1982 recession low – but there are 45 million more households today than in 1982.
And the main reason for sales to be at recession level lows is that despite “improving” job numbers, no one can afford to buy…
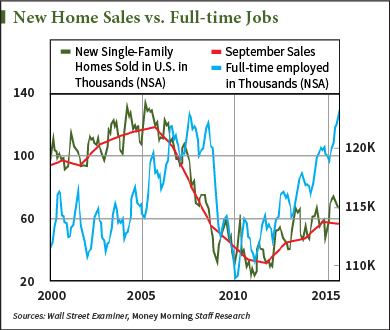
The U.S. Job “Growth” Farce
One thing the mainstream press consistently does is tie new home sales to the job market. Any uptick in sales is labeled as a result of more people working.
But what’s actually happening in the jobs market is that thanks to ZIRP, corporate executives aren’t investing in their workforce. They find it more profitable to fund stock buybacks, buy competing companies, and fire employees.
The truth is that most of the jobs being created are too-low paying and too insecure to support the purchase of a home.
That’s why the number of full-time employed has become uncorrelated from U.S. home sales. While the number of full-time jobs has continued to grow since 2013, and now returned to 2007 levels, new home sales haven’t kept pace. This chart shows the widening gap:
Since ZIRP has failed to contribute to higher-paying jobs, fewer buyers can afford the price inflation that has been driving up prices.
You might not have heard much about housing price inflation right now. Economists and policymakers have narrowed the definition of inflation to exclude asset prices – particularly housing prices. They aren’t factored into official measures of inflation, like the Consumer Price Index (CPI) and the Personal Consumption Expenditures (PCE) Index.
Instead, the 13.5% year-over-year rise in home prices is considered “appreciation.”
While this measure is volatile, the trend is absolutely clear, as the chart below shows:

This means housing gets less and less affordable each year for Americans.
This is why the growth that did happen in new home sales since the bottom in 2010 did not even come from the working age population…
Baby Boomers Drive Home Sales While “Average Joe” Suffers
The past few years’ sales growth was only a result of the demographic trend of aging baby boomers entering the second home and retirement home markets. They are often cash buyers who would liquidate their existing home to make this move.
A look at home sales by region spells out this trend. As this chart shows, there has been no recovery whatsoever in the Northeast or the Midwest. New home sales growth has been driven by a migration to the South – and even that recovery has stalled this year.

In fact, September sales in the Northeast hit a new all-time low. The West has continued to show some increase, but its sales in September were only 36% of the level reached in 2005.
So what is the average U.S. worker buying?
At the U.S. median household income of approximately $52,000 per year, households at or below the median can, with a small down payment, typically afford to purchase a home priced not more than $200,000, based on standard qualifying ratios.
Home sales in that price range just set a new September record low.
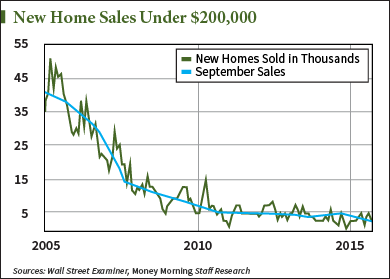
Builders simply have no incentive to build more houses faster. Instead, with near-zero money costs, builders find it far more profitable to take their time and build larger houses with more expensive features, and wait for the few upper income buyers who can purchase them.
It’s another example of how ZIRP created perverse incentives for businesses to not make real investments in growth, not provide good-paying jobs, and not provide affordable housing that Americans need.
Read Lee Adler every day at The Wall Street Examiner.
Follow us on Twitter @moneymorning.
About Money Morning: Money Morning gives you access to a team of ten market experts with more than 250 years of combined investing experience – for free. Our experts – who have appeared on FOXBusiness, CNBC, NPR, and BloombergTV – deliver daily investing tips and stock picks, provide analysis with actions to take, and answer your biggest market questions. Our goal is to help our millions of e-newsletter subscribers and Moneymorning.com visitors become smarter, more confident investors.To get full access to all Money Morning content, click here.
Disclaimer: © 2015 Money Morning and Money Map Press. All Rights Reserved. Protected by copyright of the United States and international treaties. Any reproduction, copying, or redistribution (electronic or otherwise, including the world wide web), of content from this webpage, in whole or in part, is strictly prohibited without the express written permission of Money Morning. 16 W. Madison St. Baltimore, MD, 21201.