
I’ve been trading and teaching for more than 25 years. Since 2009, I’ve taught 300,000 traders the specific ways they can spot high-probability, low-risk trades.
But I’ve been making investing profitable here at Money Morning and in my Power Profit Trades service for about a year now.
So I think this is the perfect time for an “anniversary present.”
It’s a priceless antique, more than 300 years old, and it comes all the way from the Japan of the samurai.
And it’s incredibly useful. You can use it to trade the right way and make serious money every day.
Let me show it to you…
More Powerful Than Prediction
I love predictive indicators, like the relative strength index and moving average convergence/divergence. Of course, my favorite is my Money Calendar, which crunches thousands of data points going back more than 10 years to predict the direction and patterns of some of the markets’ best, most liquid stocks. It suits me.
Still, no matter what kind of technical prediction tools we have handy, certain events can happen – global or domestic, in the markets or out – that we just have no way of predicting.
For that, we need a reliable source to tell us exactly how the market is reacting, in real-time.
That’s where my 18th century anniversary present comes into play. It’s called “candlestick” charting, and it’s one of my favorite ways to get an instant read on the markets’ sentiments.
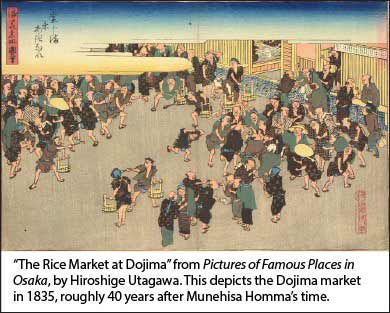
It’s hard to say who invented this charting technique, but the person who made the most of it, the man we call “the father of the candlestick chart,” was a trader called Munehisa Homma (1724-1803).
Homma was a rice merchant… and a lot more… in 18th century Sakata, Japan. He recognized that quality information was critical, and let me tell you, Homma had “the goods.” He’s thought to have had a network of men, or agents, stationed every 6 kilometers (3.7 miles) along the 600-kilometer (372 mile) distance between Sakata and Osaka, so he’d have a better picture of market prices across a wider slice of Japan – and a huge lever over the competition in Sakata.
He also said “when all are bearish, there is cause for prices to rise,” making him perhaps the first contrarian investor on record.
But Homma’s biggest impact was in market psychology: emotions. In 1755, he wrote the very first book in the East or West on market psychology, “The Fountain of Gold – The Three Monkey Record of Money.” Homma knew that psychology was a huge part of the trading he did each and every day at the Dojima Rice Market.
At the Dojima market, like any market, prices were tied to the supply and demand of rice. But they were strongly influenced by the emotions of the rice traders.
So he used charts like ones you’re about to see to represent those emotions.
A Great Idea to This Day
Now, candlestick charting (in all its forms) has changed a bit from Homma’s time to ours. But there are a few overriding principles that exist in both modern Western and Japanese candlestick analysis today:
- Markets fluctuate, and market moves are based on the expectations and emotions of the buyers and sellers – the investors.
- Price is a reflection of all known information.
- Price action itself is more important than the reasons behind it. This means how a price moves – up or down, heavy volume or light, fast or slow – is much more important than why a price moves, such as earnings, new products, or company scandals.
Now let’s talk about the key components of the candlestick chart…
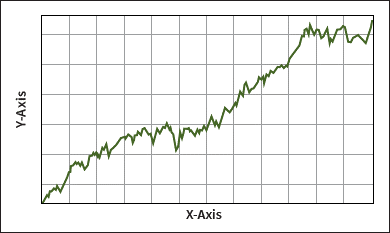
When it comes to tracking the markets, you’re probably the most familiar with charts like this:
Candlestick charts, however, look like this:
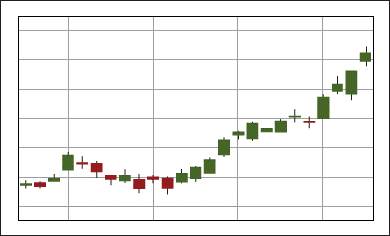
The Japanese candlestick analyzes four different components of price action, whether it be over a one-minute, one-hour, or one-day period of time.
A “candlestick” represents the time frame that you’re charting, and it can be any time frame your charting software will allow. Even one month’s or one year’s price action can be expressed by one candle.
To keep things simple, we’ll use a one day, one candlestick representation.
The Japanese candlestick looks at the same four things as the bar chart…
- the opening price;
- the closing price;
- the highs of the opening and closing prices; and
- the lows of the opening and closing prices.
What I really like about the Japanese candlestick, though, is the way it’s visually constructed, well, like a candle.
Like the real body of a candle, a candlestick shows two different colors – each representing whether a stock closed higher or lower than its opening price.
Depending on your charting software, the color coding of the body is usually black or white, but many others use green and red.
Black or red usually indicate that the stock closed lower than its opening price, while white or green usually indicate that the stock closed higher than it its opening price.
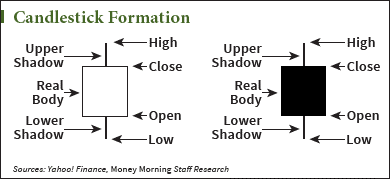
You can see this in the image above: The black part of the candlestick reflects that a stock closed lower than the opening price, and the white part of the candlestick reflects that a stock closed higher than the opening price.
This is important, because looking at whether a stock closed higher or lower tells you whether the bulls or the bears ultimately won the “price battle.”
So, when you see consecutive days where the price closes higher than its opening, then this speaks to a bullish trend. You also want to take a look at whether the price closed at or near its high of the trading day.
Now, where a stock closes on a candlestick – in comparison to the last trading day, or last two trading days – is extremely important for determining market psychology of the moment.
This happens to be where Munehisa Homma’s technique really shines.
There are several different patterns to identify, including two- and three-day patterns. I’ll talk about those with you soon.
Follow Tom on Facebook and Twitter.
Tom teaches regular investors how to trade like seasoned pros twice each week in Power Profit Trades. Click here to get it for yourself at no charge, and you’ll receive Tom’s latest investor guide that shows you how to make a 100% profit on one of the world’s biggest, most valuable companies… in less than 30 days.
About Money Morning: Money Morning gives you access to a team of ten market experts with more than 250 years of combined investing experience – for free. Our experts – who have appeared on FOXBusiness, CNBC, NPR, and BloombergTV – deliver daily investing tips and stock picks, provide analysis with actions to take, and answer your biggest market questions. Our goal is to help our millions of e-newsletter subscribers and Moneymorning.com visitors become smarter, more confident investors.To get full access to all Money Morning content, click here.
Disclaimer: © 2016 Money Morning and Money Map Press. All Rights Reserved. Protected by copyright of the United States and international treaties. Any reproduction, copying, or redistribution (electronic or otherwise, including the world wide web), of content from this webpage, in whole or in part, is strictly prohibited without the express written permission of Money Morning. 16 W. Madison St. Baltimore, MD, 21201.