")
Given the performance of the US economy in the first quarter of 2024, analysts remain optimistic about future prospects. Stakeholders – investors and traders alike – are buoyed by current trends, albeit at overvalued levels. There are bugbears within the framework, notably persistently high inflation, unsustainable consumer-side demand, and high interest rates. These concerns are not going away anytime soon, and even if they abate, they will reach equilibrium at levels that consumers are already struggling to contend with.
The objective is a reduction in the inflation rate through a combination of fiscal and monetary policy measures. By slowing down the pace of general price rises, possibly even reversing key agitators, a sense of normalcy may return. As it stands, all indications point to bullish sentiment in the financial markets. We see evidence of this at traditional brokerages and online trading platforms alike.
Analysis of MetaTrader5 platforms where retail traders routinely operate, provides proof positive of net bullish activity. A strong Put/Call volume ratio – a key barometer of sentiment, exists. According to Ycharts, the current CBOE Equity Put/Call ratio is 0.65 – substantially lower than the high on January 10, 2024, of 1.10*. For the year-to-date (YTD), the Put/Call equity ratio is low, as one expects from a rallying bull market.
Source: https://ycharts.com/indicators/cboe_equity_put_call_ratio
The year-to-date performance of key markets in the US is as follows:
- The Dow Jones Industrial Average has a year-to-date performance of 4.74%
- The NASDAQ composite index has a year-to-date return of 9.44%
- The S&P 500 index has a year-to-date performance of 9.74%
- The Russell 2000 index has a year-to-date return of 2.22%.
The three-month performance metrics for these key US markets (barring the Russell 2000) belie the longer-term trends we see over one year. Given that markets were generally suppressed throughout the first half of 2023, the year-to-date figures make for a less impressive reading. However, by extrapolating, investors can better understand the current performance against the 50-day moving averages and the 200-day moving averages.
For example, the S&P 500 index is currently hovering around 5234.18, with a 50-day MA of 5009.675, and a 200-day MA of 4599.82. The market has been outperforming the moving averages since mid-November 2023 – a strong case for increased optimism.
Indeed, the inclusion of Bollinger bands in the technical analysis provides further insights. Recall that a scenario depicting the upper Bollinger band meeting the current level of the market tends to suggest a downward revision toward the mean. By contrast, a lower Bollinger band intersecting with the current level of the market tends to indicate an upward revision towards the mean.
Presently, the upper Bollinger band reading is 5242.22, and the lower Bollinger band is at 5037.84. If anything, the S&P 500 index is likely to retrace towards the center band at 5140.03, although there is plenty of juice left in the tank.
What is driving the rally and when will it crash?
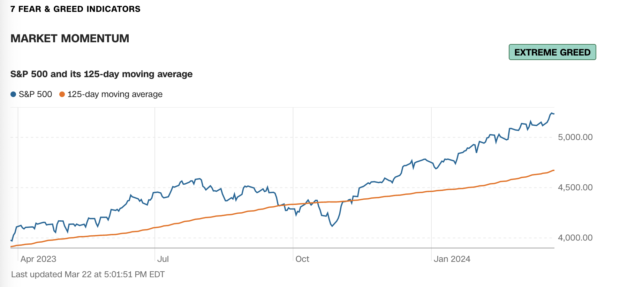
Source: https://www.cnn.com/markets/fear-and-greed
A multitude of factors is responsible for current market sentiment. Foremost among them is the sentiment of the Federal Reserve Bank vis-a-vis the FOMC meeting minutes. Since the Fed is targeting a 2% inflation rate, steps must be taken to drive the market towards this objective. While the Fed didn’t announce an interest-rate cut in its most recent meeting, statements to that effect were made and are expected to come good in 2024.
Stakeholders in the financial markets welcomed these future-oriented sentiments despite the fact that no rate cut was forthcoming. The expectation is one of three rate cuts before the end of the year, driving the federal funds rate lower to the tune of approximately 0.5% – 0.75% in 2024. While precise details remain uncertain, the timeline for the Fed rate cut is this year.
Presently, there is too much tightness in the US labor market, and inflation is persistently high. Investor sentiment is appreciative of the Fed’s perspective on this matter, with broad rallies ending the penultimate week of March trading.
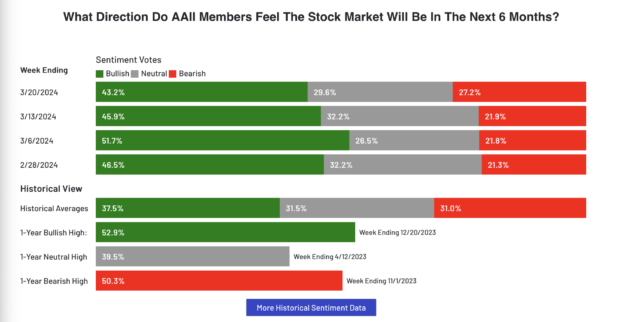
Source: AAII https://www.aaii.com/sentimentsurvey
Currently, interest rates are at decades-long highs. The second quarter of 2024 is fast approaching, with high levels to maintain. Caution is advised – corrections often accompany boom periods. Traders and investors alike are eager to lock in profits, particularly when markets are peaking at multi-month or multi-year highs.
The fear and greed index reading is currently pointing towards greed/extreme greed levels. But it’s not the only metric that points in this direction – others include stock price breadth, stock price strength, and put & call options. Market volatility is down at a neutral level, neck, and neck, with its 50-day moving average.
The other drivers of market momentum include inflationary forecasts, company and shareholder reports, and the performance of global powerhouses like Apple, Google, Boeing, Bank of America, Wells Fargo, JPMorgan, and the like. We see various surveys indicating how people feel about the stock market and where it will be in the next six months. For example, for the week ending March 20, 2024, 43.2% of members in the AAII investor sentiment survey were bullish, 29.6% neutral, and 27.2% bearish.
Bullish expectations have cooled somewhat, which is in line with the trends we are seeing in the Fear and Greed Index. The main drivers of stock market performance was the expectation of rate cuts. There are also other peripheral issues in play, such as the AI boom. The positive sentiment is felt worldwide, with European markets also at elevated levels. Watch this space, big changes are in the pipeline.
Members of the editorial and news staff of the Daily Caller were not involved in the creation of this content.